
Mapping and modelling with ArcGIS
Project Title : Digitizing the Geology map of Dominica
Background and method
Digitizing maps is the process of converting physical and other cartographic information into a digital format. Digitize map formats improves data accessibility, fosters enhance and efficient analysis, and can be integrated with other geospatial datasets. In this project we digitize the Geology map of Dominica.
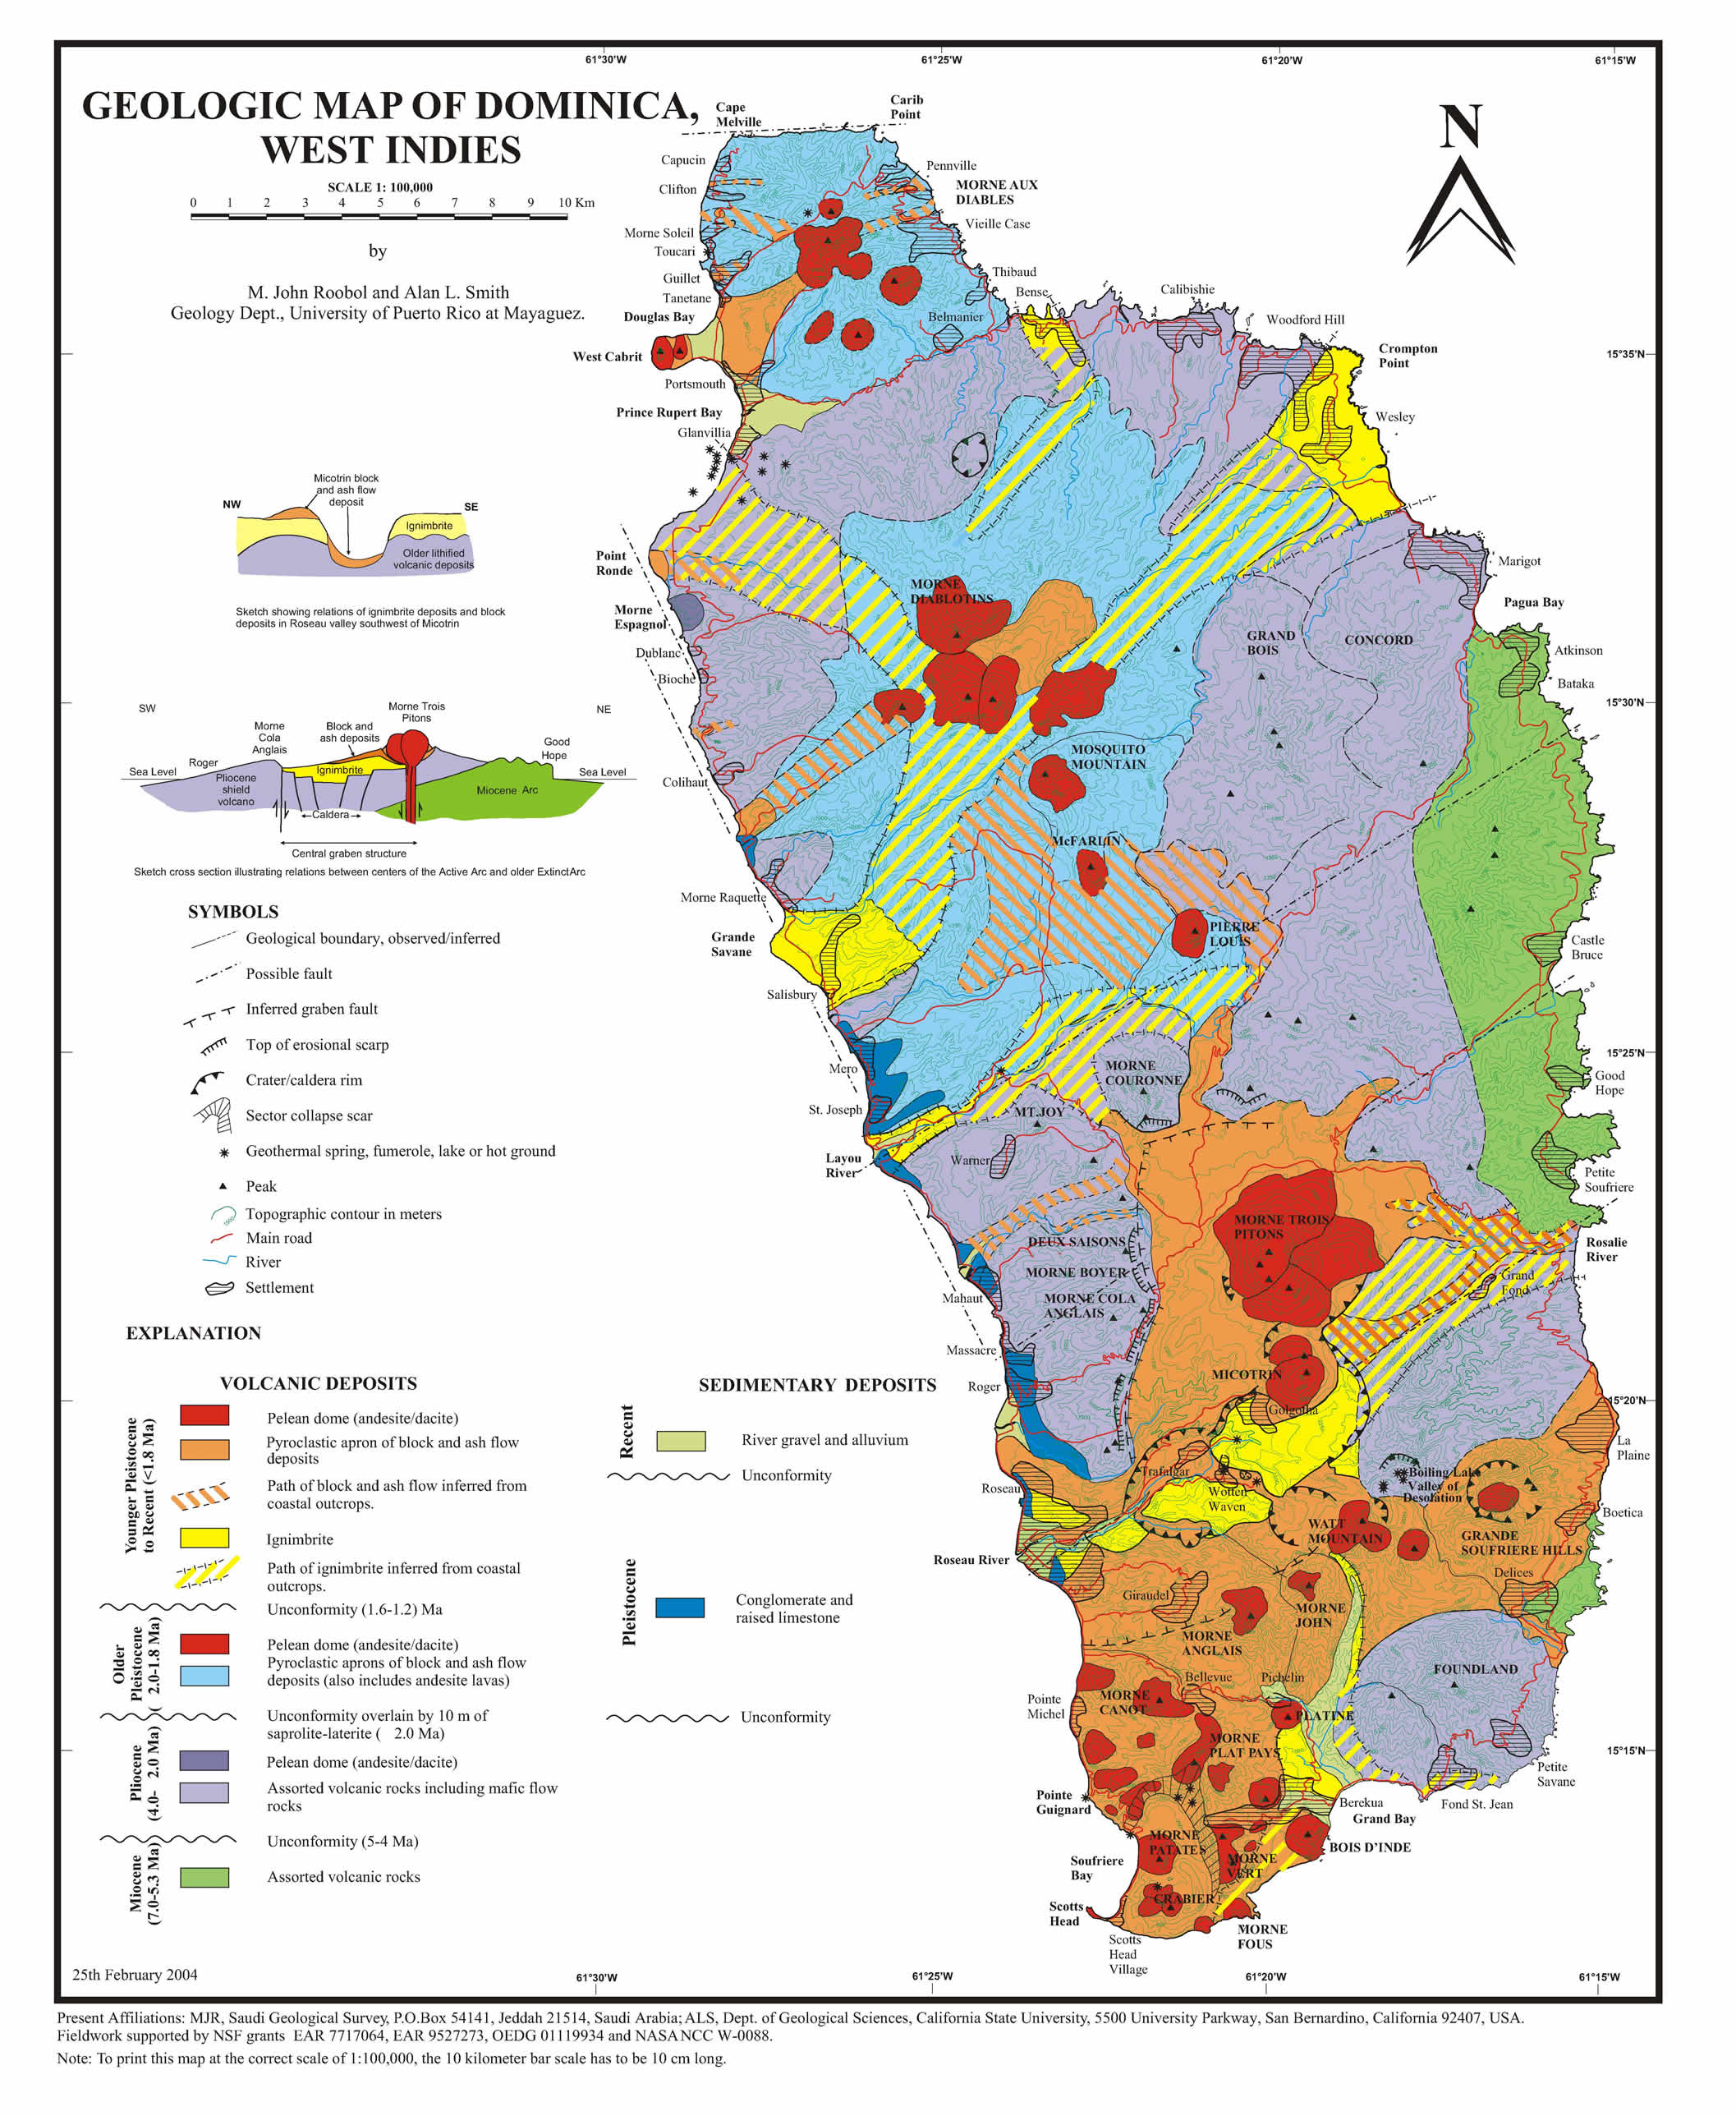
A picture format of the Dominica Map, was provided by the Geoinformation Science Group at Technische Universiatet Darmstadt. n/b. Original source of the data is referenced in the final map.
 </p>
</p>
Geology Map of Dominica in picture format
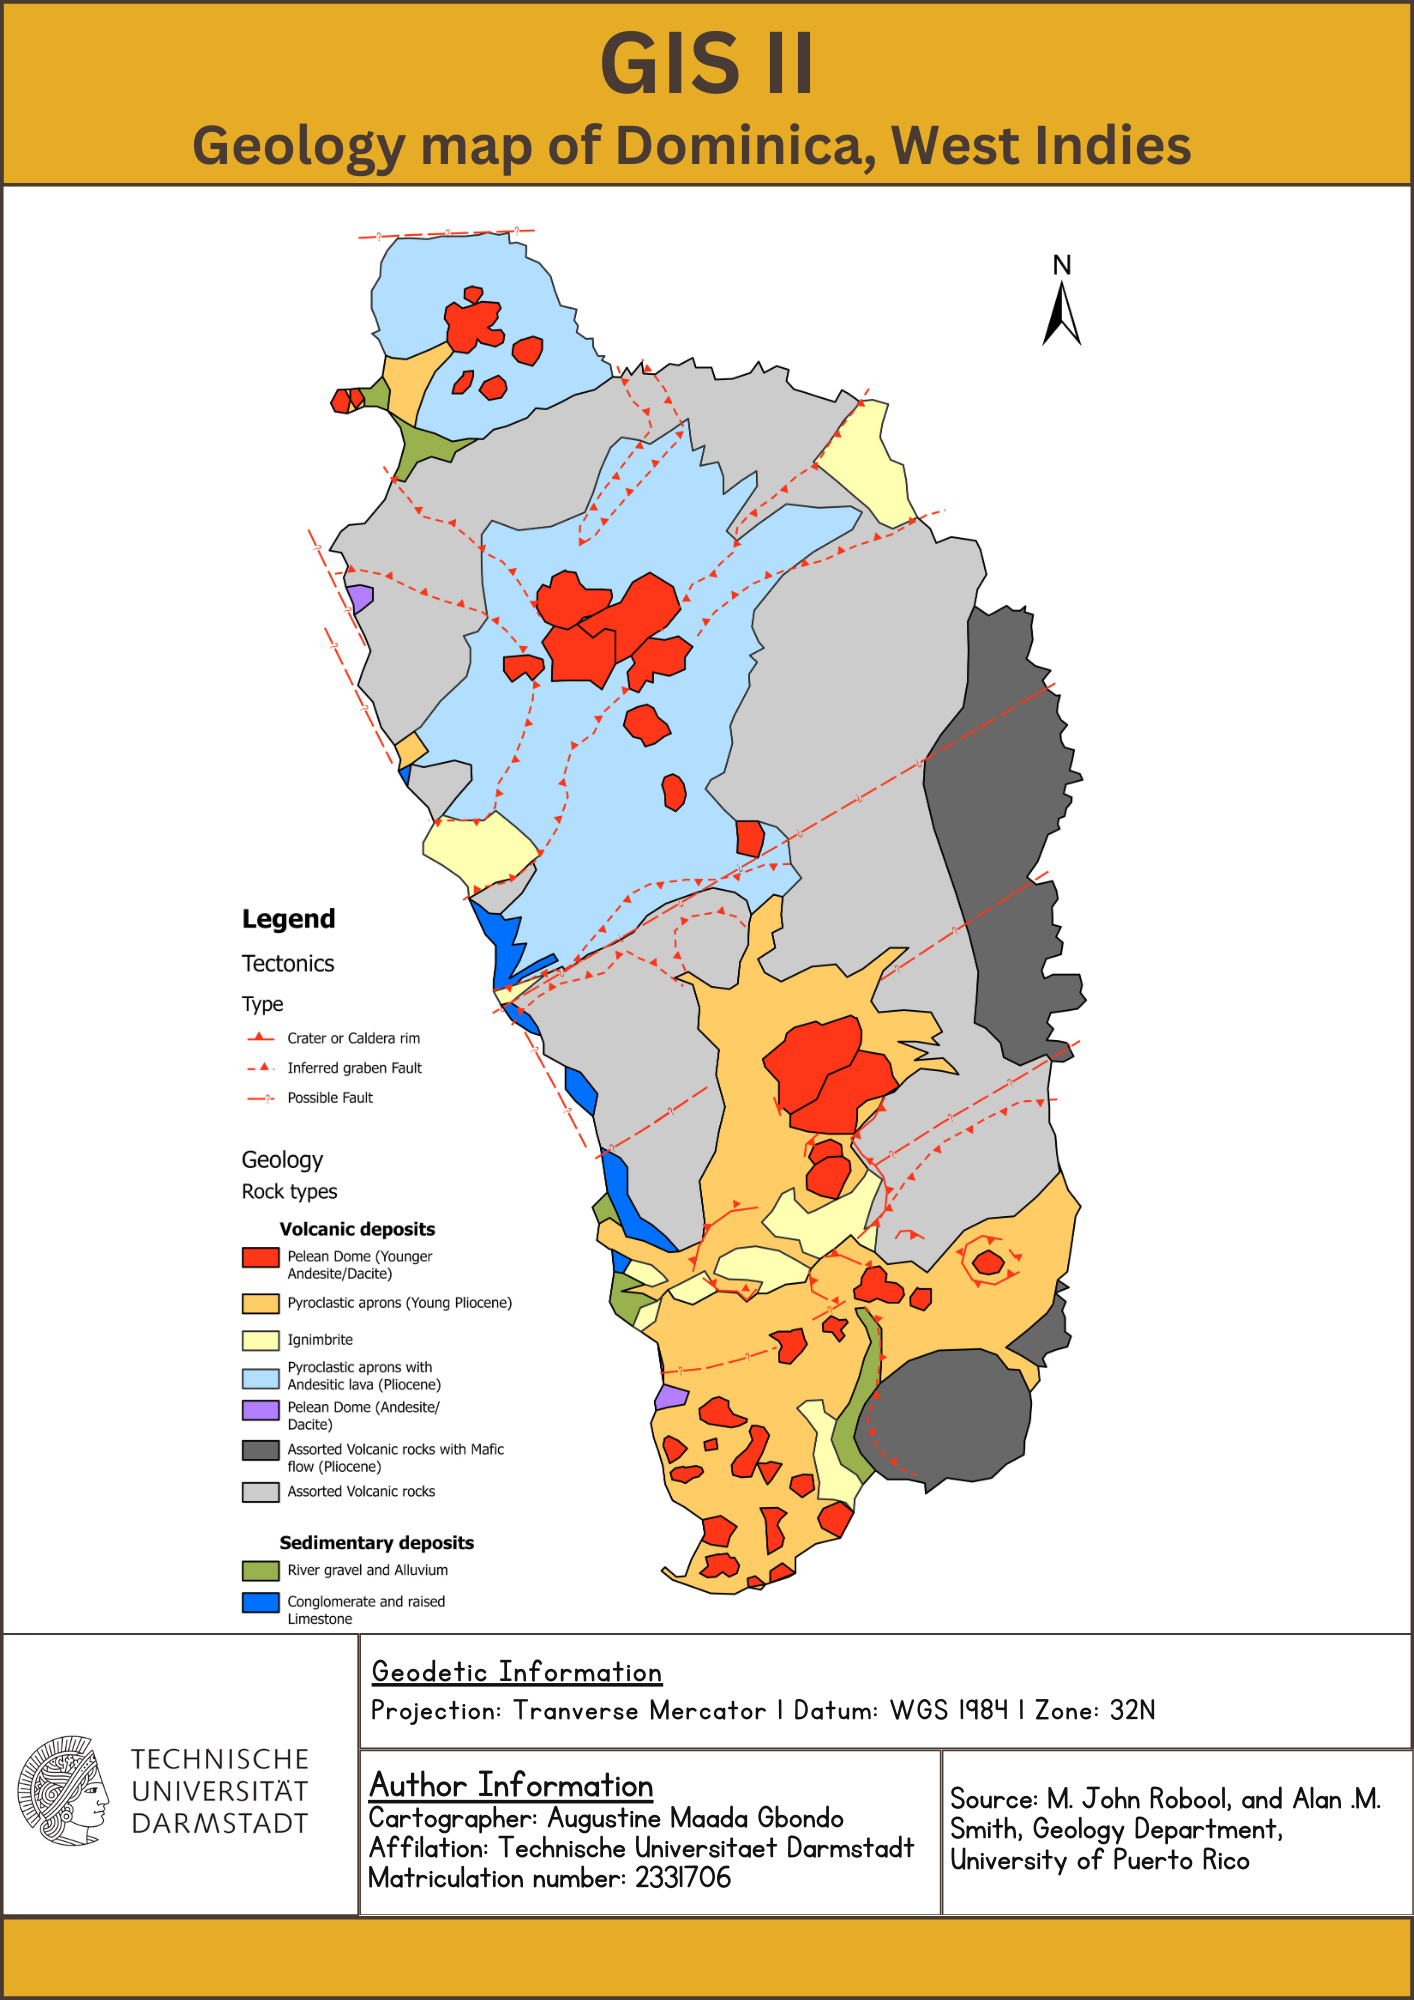
The project uses ArcMap and its toolboxes for geoprocessing and data management. Feature classes (lines and polygons) were created and stored in the ESRI geodatabase (.gbd). To georeferencing toolbar was used to process the data. Quality control was ensured using the Topology tool in the manage edits toolbar.
*Deliverables
 </p>
</p>
Digitized Geology map of Dominica
Calculation of the volume of Dominica
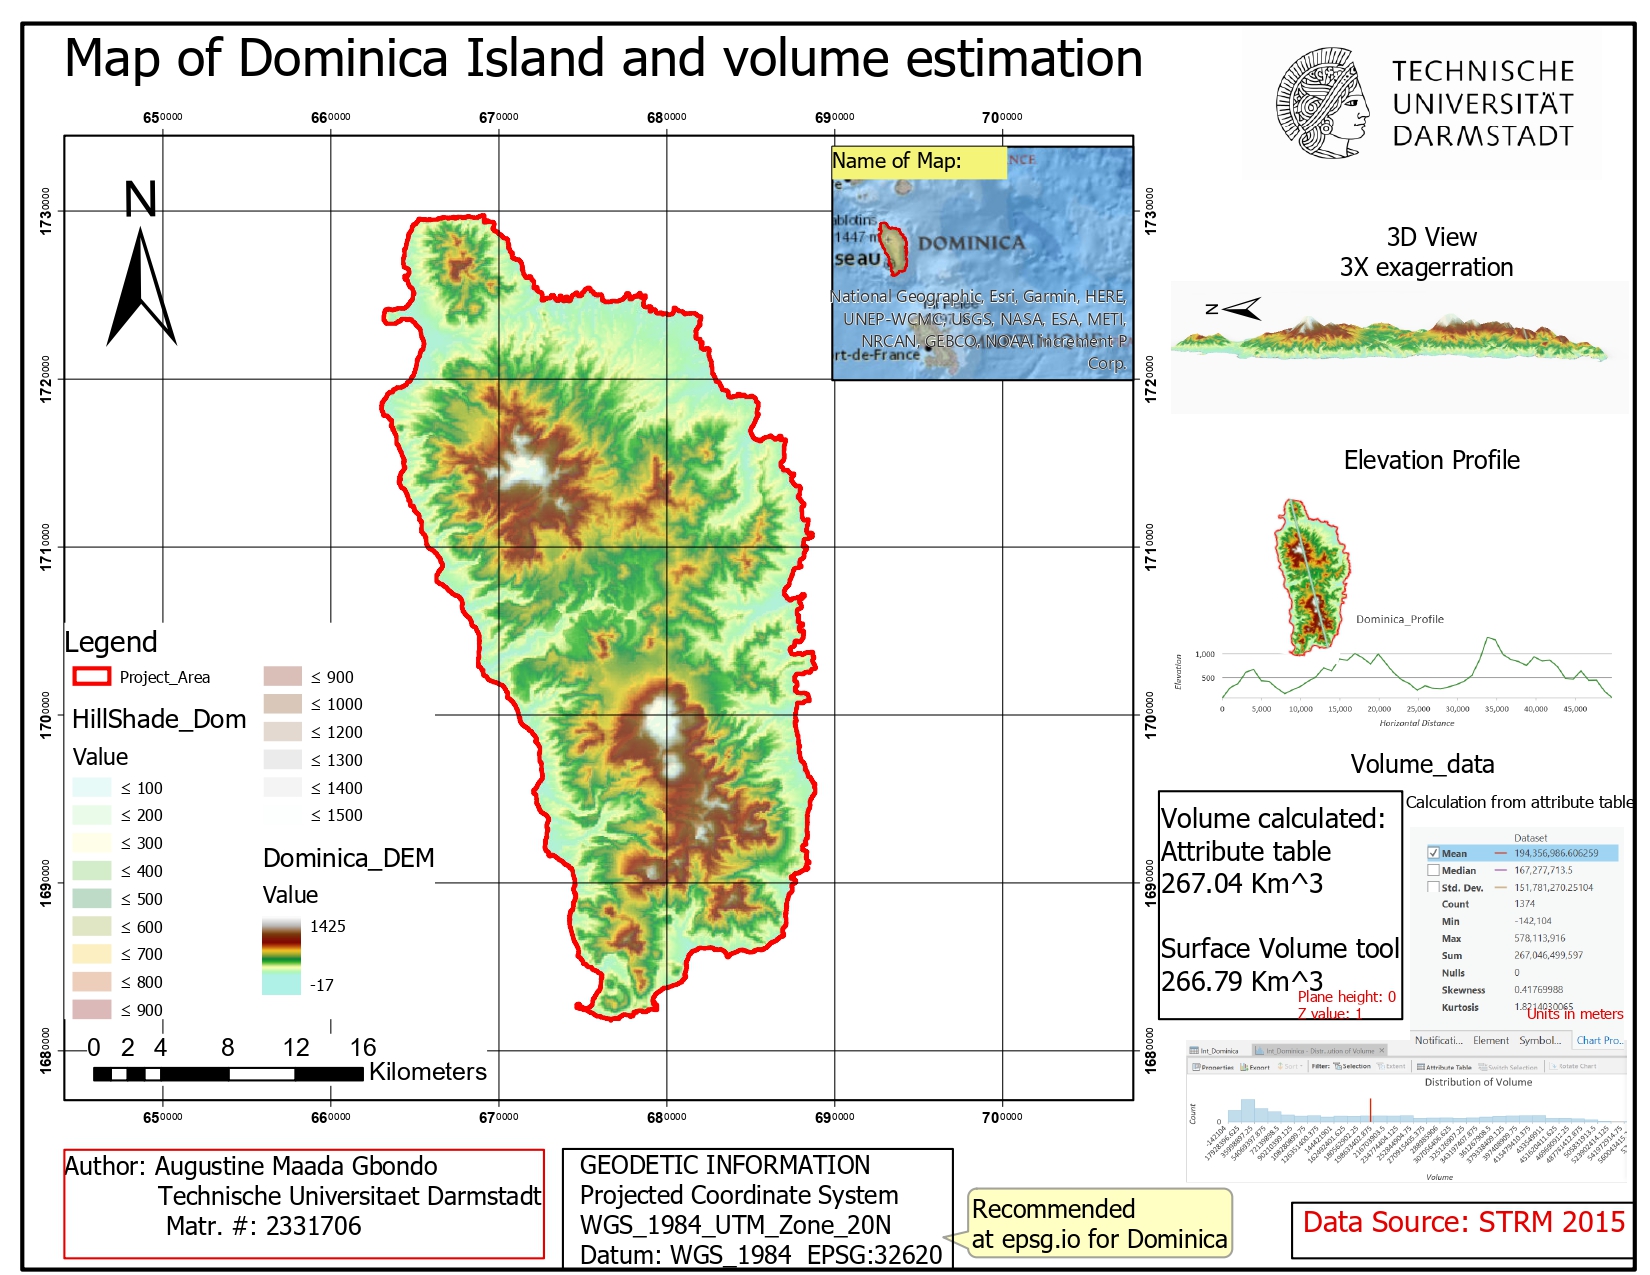
Another task we accomplished was to calulate the volume of Dominica. The main aim of this workflow was to acquire the technique of estimating 3D volume of an area of interest - which can be important in evaluating materials moved during mass wasting events.
A DEM of Dominica was used to calculate the volume. The DEM raster was downloaded from opendem.org and cliped to the Dominica Area of interest (AOI). The Surface Volume tool was used to calculate the volume. The input data was the clipped Dominica DEM and the reference plane was specified as above sea level. An output table was calculated to store the volume results. The map was then exported into a layout and other information added.
Tools used : ESRI Geodatabase, Toolboxes: [Analysis toolbox –> Extract toolset, 3D Analyst toolbox –> Functional Surface toolset]
Skills developed : Data management, geoprocessing, spatial analysis using ArcMap.
Deliverables
 </p>
</p>
submitted PDF report
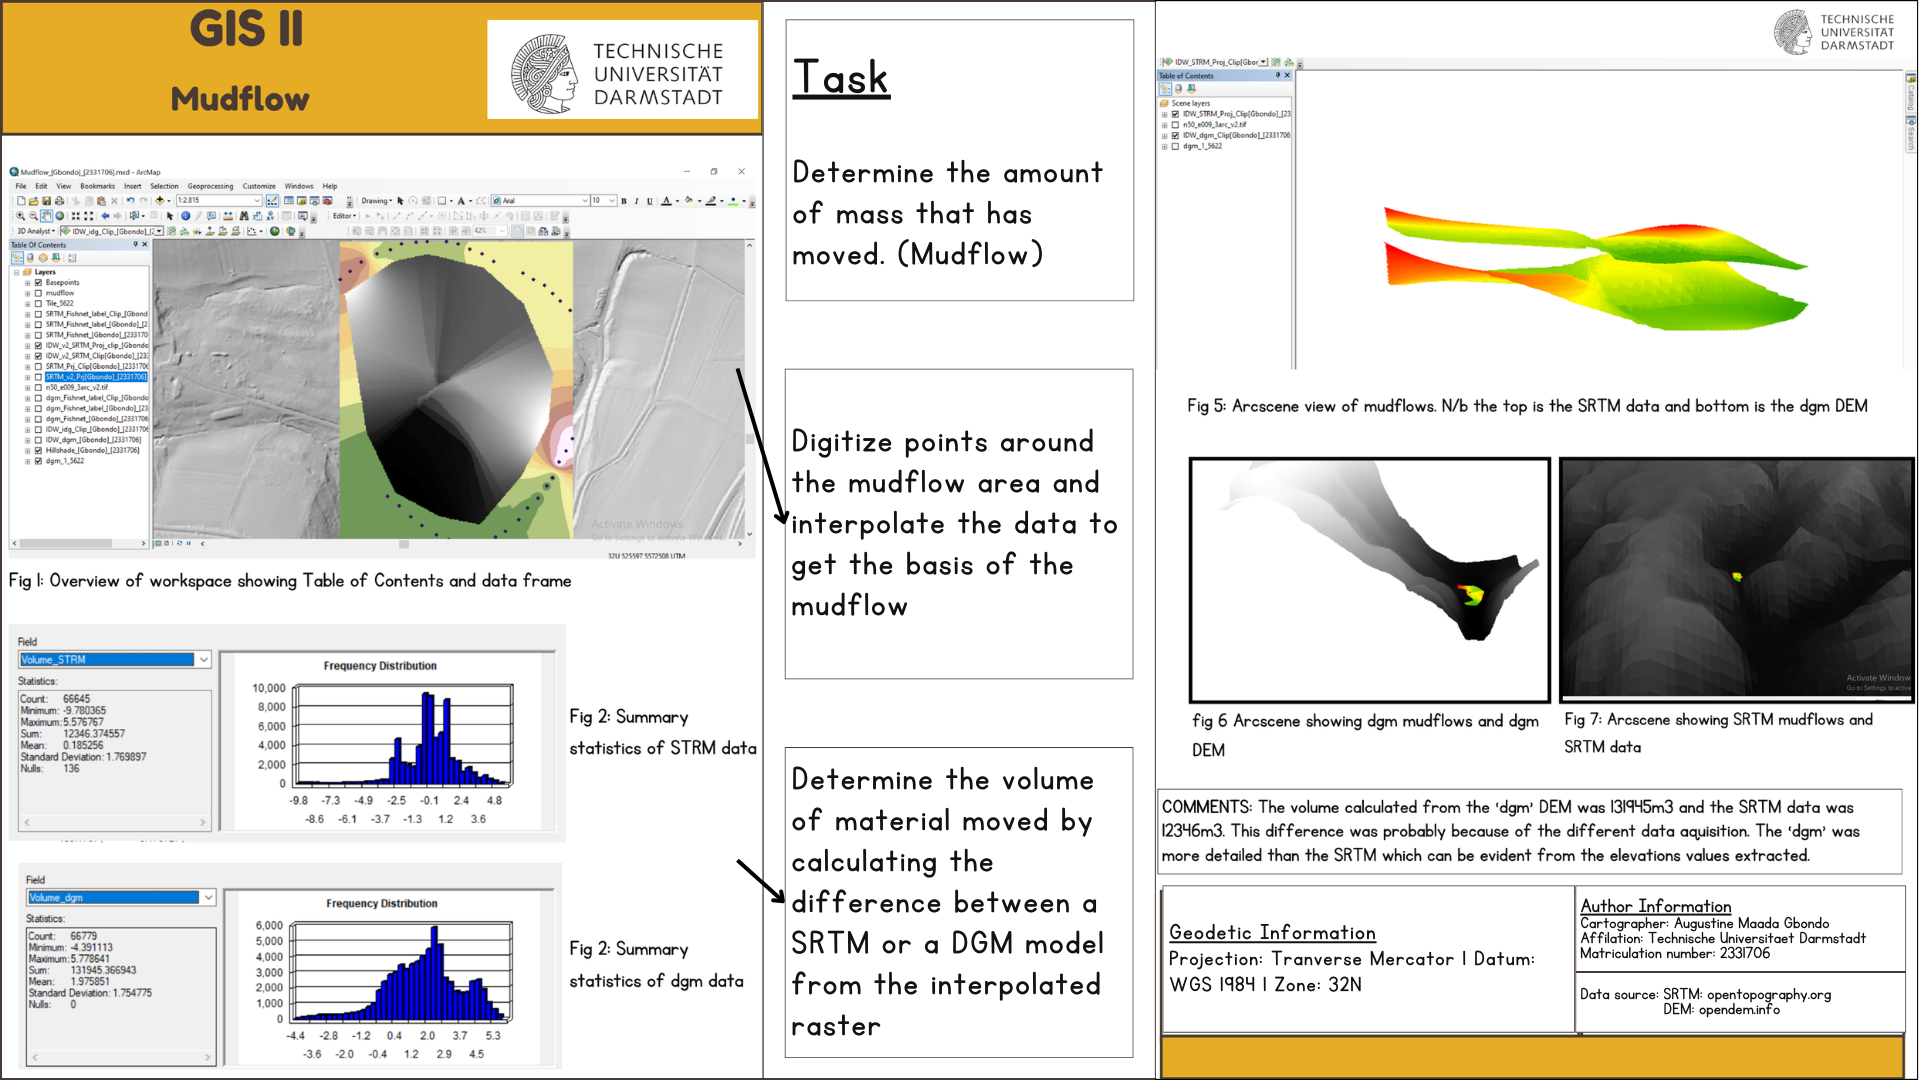
Project Title : Assessing the volume of a landslide using remotely sensed data [Mudflow]
Background and method
This project intended to investigate a site with a history of landslides, where proposed dam is planned. Understanding how much material have been moved is important in estimating the severity of the landslides, as well as the feasibility of the area for the project.
The data used for this exercise were DEM data, Area of interest (AOI) - basis of the mudflow, and SRTM data. The first two data was provided by the Geoinformation Science Group at Technische Universitaet Darmstadt, and the SRTM was downloaded at Earth Explorer
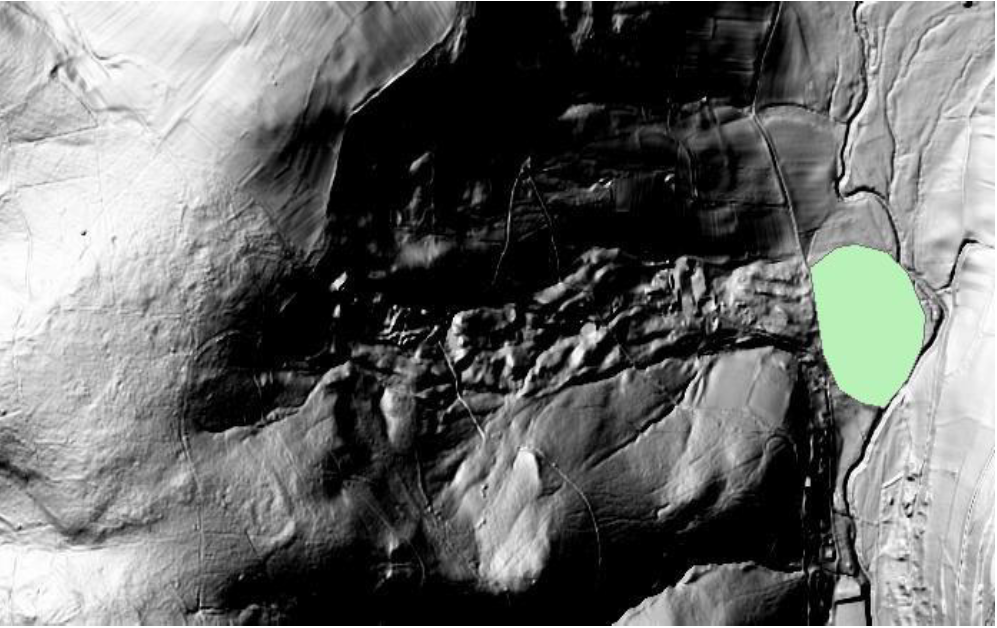
To analyze the potential impact of a planned dam in a landslide-prone area, the first step includes creating a new ArcGIS project and add the relevant dataset. A suitable hillshade raster was created from the provided DEM data and was clipped to the area of interest (AOI) representing the Mudflow. To create a second raster surface that represents the relocated material, points were digitized (using the Edit toolbar) around the AOI. This data was then interpolated using Spline and IDW tools, for comparison.
The volume of the material was calculated by creating a 1x1m fishnet using the create fishnet tool, and assigned values to the attribute table. This process can also be done using the Math Toolbox or Raster Calculator. The results were verified by repeating the workflow with an SRTM data, to compare the two calculated volumes.
*Deliverables
 </p>
</p>
Digital elevation Model (DEM) of the project area. The green feature layer represents moved material from the mudflow event
Tools used : ESRI Geodatabase, Toolboxes: [Georeferencing tools –> Editing toolbar], [Analysis toolbox –> Extract toolset], [3D Analyst toolbox –> Functional Surface toolset], [Edit toolbar], [Spatial Analyst toolbox; surface toolset, Interpolation toolset, {Data Management toolbox –> Sampling toolset, create fishnet}]
Skills developed : Data management, geoprocessing, spatial analysis, geostatistics, modelling using ArcMap.
*Deliverables
 </p>
</p>
An image showing tthe delination of the mudflow area, volume calculated using the two elevation models, and viewed in ArcScene
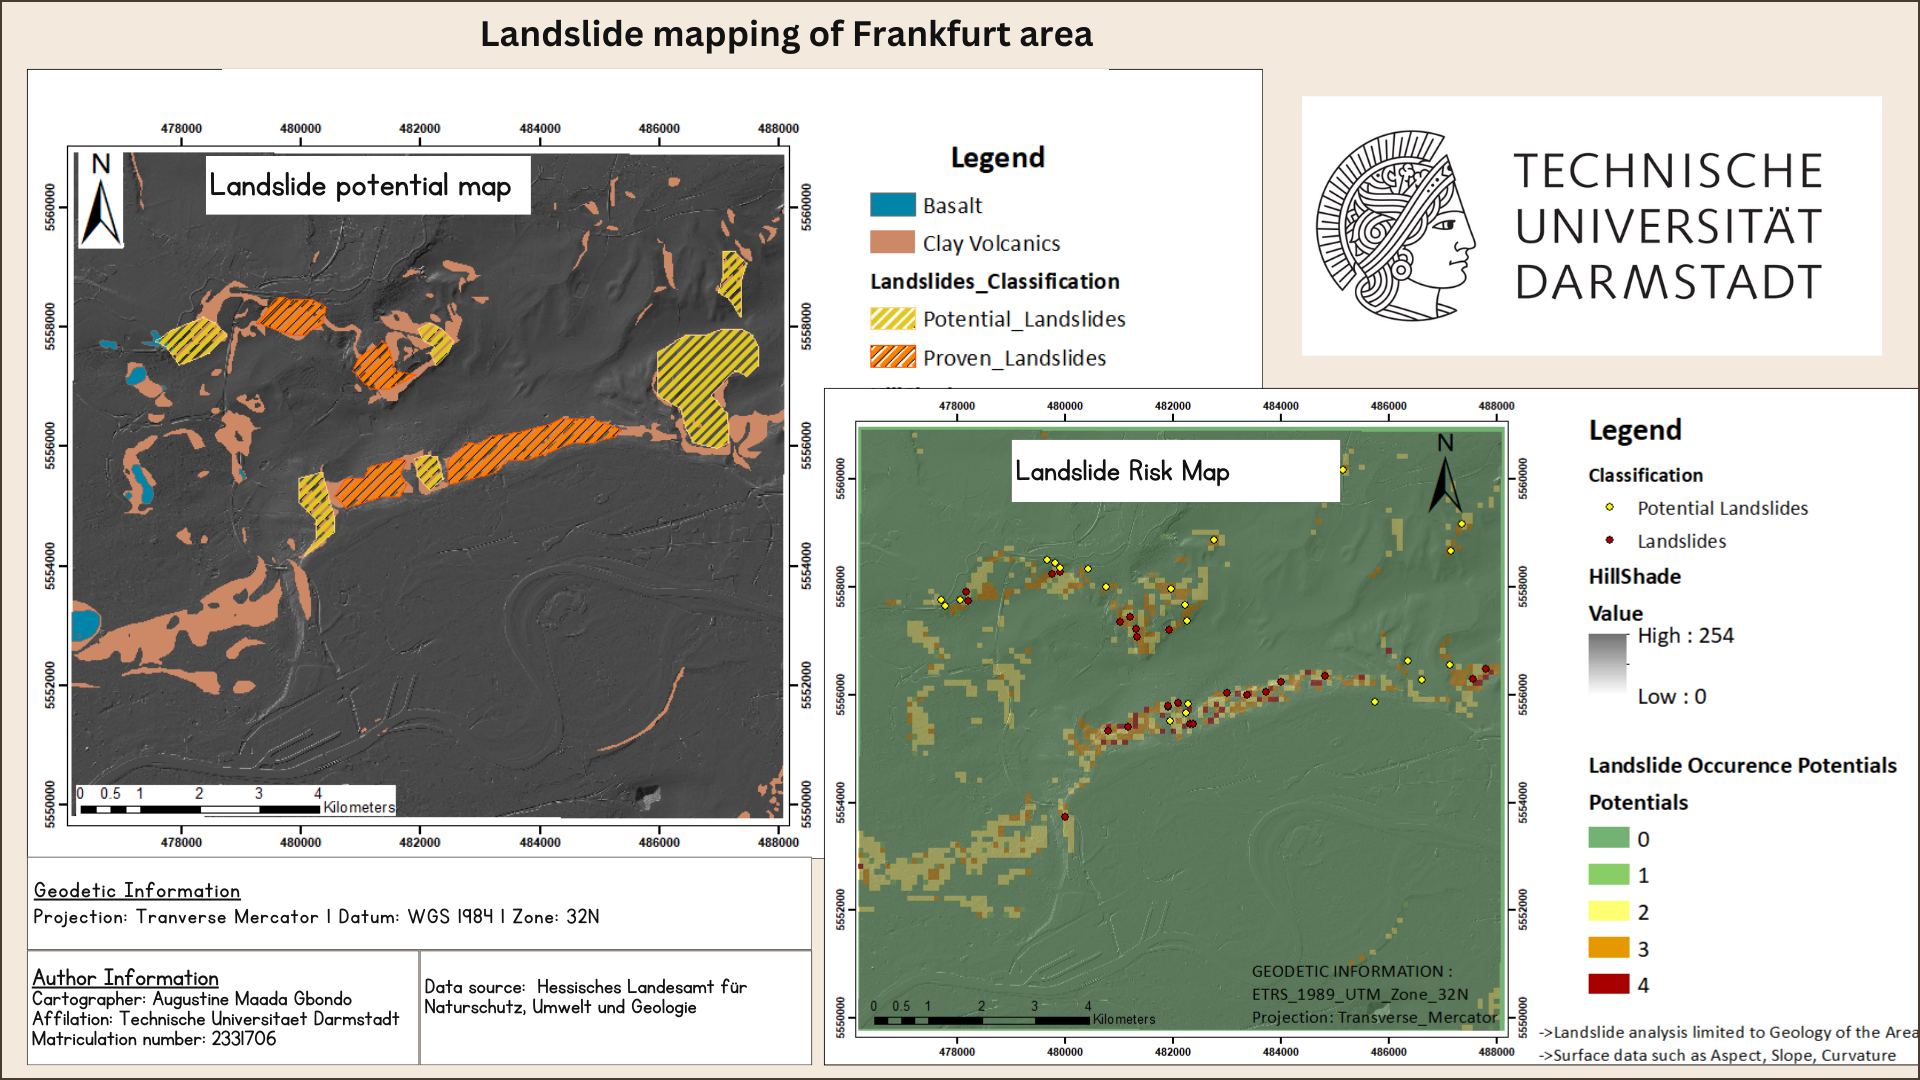
Project Title : Assessing mass movement potentials around Frankfurt on the basis of given parameters
Tools used : ESRI Geodatabase, Toolboxes: [Spatial analyst toolbox –> surface toolset, extraction toolset], [Data Management toolbox –> Sampling toolset –> create fishnet], [Analysis toolbox –> overlay toolset]
Overview
A landslide is a type of “mass wasting,” characterized by any down-slope movement of soil and rock under the direct influence of gravity. By modeling potential landslides, potential disasters can be avoides and reduce or eliminate loss of life and damage to properties.
This project intended to model the potential of landslides around Frankfurt area. GIS methods of landslide hazard assessment are usually done on the basis of given parameters. These parameters include DEM (slope and relief), Geology, Soil, Hydrology, Geomorphology, Landuse etc.
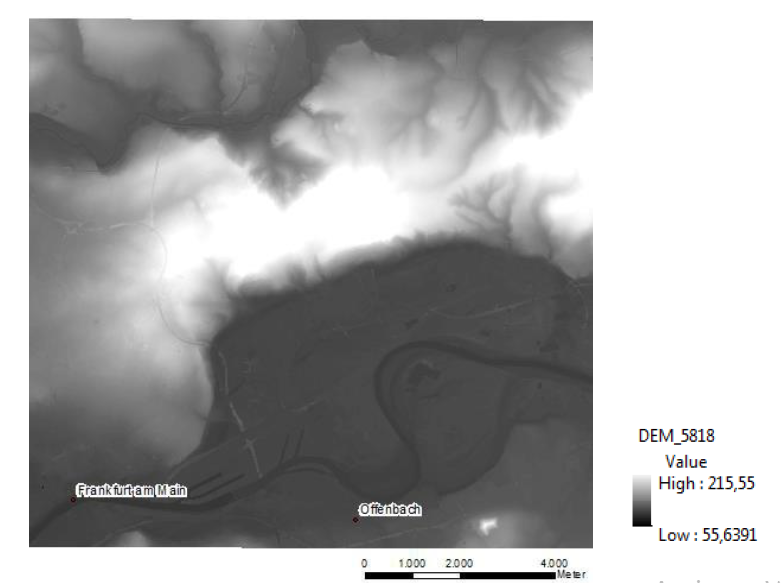
The data used for this exercise includes a DEM map (opendem.org), historical landslide map, Suceptible units for landslide and Area of Interest (AOI) polygon, all which were provided by the Geoinformation group at Technische Universitaet Darmstadt.
 </p>
</p>
Digital elevation Model of the study area
The surface toolset was used to create several surface information such as slope, aspect, and curvature from the DEM, and this data was added to the Landslide feature class. The geological data (vector format) was reclassified into two classes based on potential for landslide. This data was spatially joined to the landslide data.
To focus on areas being investigated for potential landslides, a fishnet was created to join and limit surface information to susceptible units.
Additionally, a second potential map using hillshade at different angles was developed, and the areas with potentials were digitize.
*Deliverables
 </p>
</p>
Modelled landslide map (left) and Potential landslide map (right) based on our study
Skills developed : Data management, geoprocessing, spatial analysis, geostatistics, modelling using ArcMap.
Project Title : Choosing a suitable location for a waste disposal site using Spatial Analysis
Tools used : ESRI Geodatabase, Toolboxes: [Conversion Tools –> To Raster], [Spatial Analyst toolbox –> (Reclassify, {Multivariate –> Iso Cluster, Maximum Likelyhood Classification}, {Map Algebra toolset –> Raster calculator}, {Zonal toolset})]
Background and method
This project intended to choose a suitable site for a waste disposal by taking into account several environmental, financial and social factors. Five areas were proposed for a waste deposit site, and this task aimed at choosing the best site.
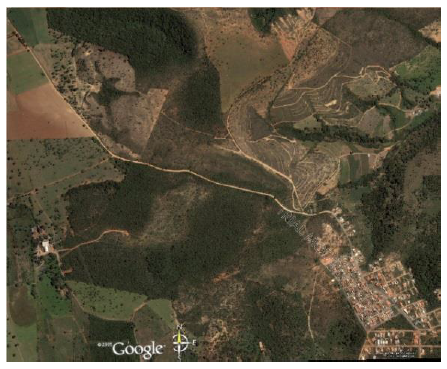
The data used for this exercise were the settlement area, Potential sites for waste disposal, a DEM, digitized geological map, and a georeferenced Google Earth image. These were provided by the Geoinformation Science Group at Technische Universitaet Darmstadt.
 </p>
</p>
Satellite imagery of our project area
Several criteria are predefined in selecting a suitable area. A flat area and suitable geology, should be environmentally (do not affect the biodiversity), it should be far from river or creek to avoid contamination of the water bodies, and also have good connection to the settlement.
A new project was setup with ArcMap and a coordinate reference system for the working environment was defined. The data provided was imported, vector files were rasterized, and later standardized using suitable calculations. The topography was determined by calculating a standardized form of the slope. The geology map was rasterized (using the Polygon to Raster tool in the To Raster toolset ) and reclassified using the Reclassify tool into two classes. By using the Iso Cluster tool and Maximum Likelyhood Classification tool, the Google Earth image was also classified into two categories to distinguish the forest areas (Greenery) from other areas. Proxies and indicators of river and streams were also determined and used as input parameters.
After the initial data processing, the suitability map was calculated using the Raster calculator tool. This tool uses a weighted input of the relevant parameters to model a suitable site for waste disposal. Zonal statistics was then applied to rank the suitability of the different sites based on the model results.
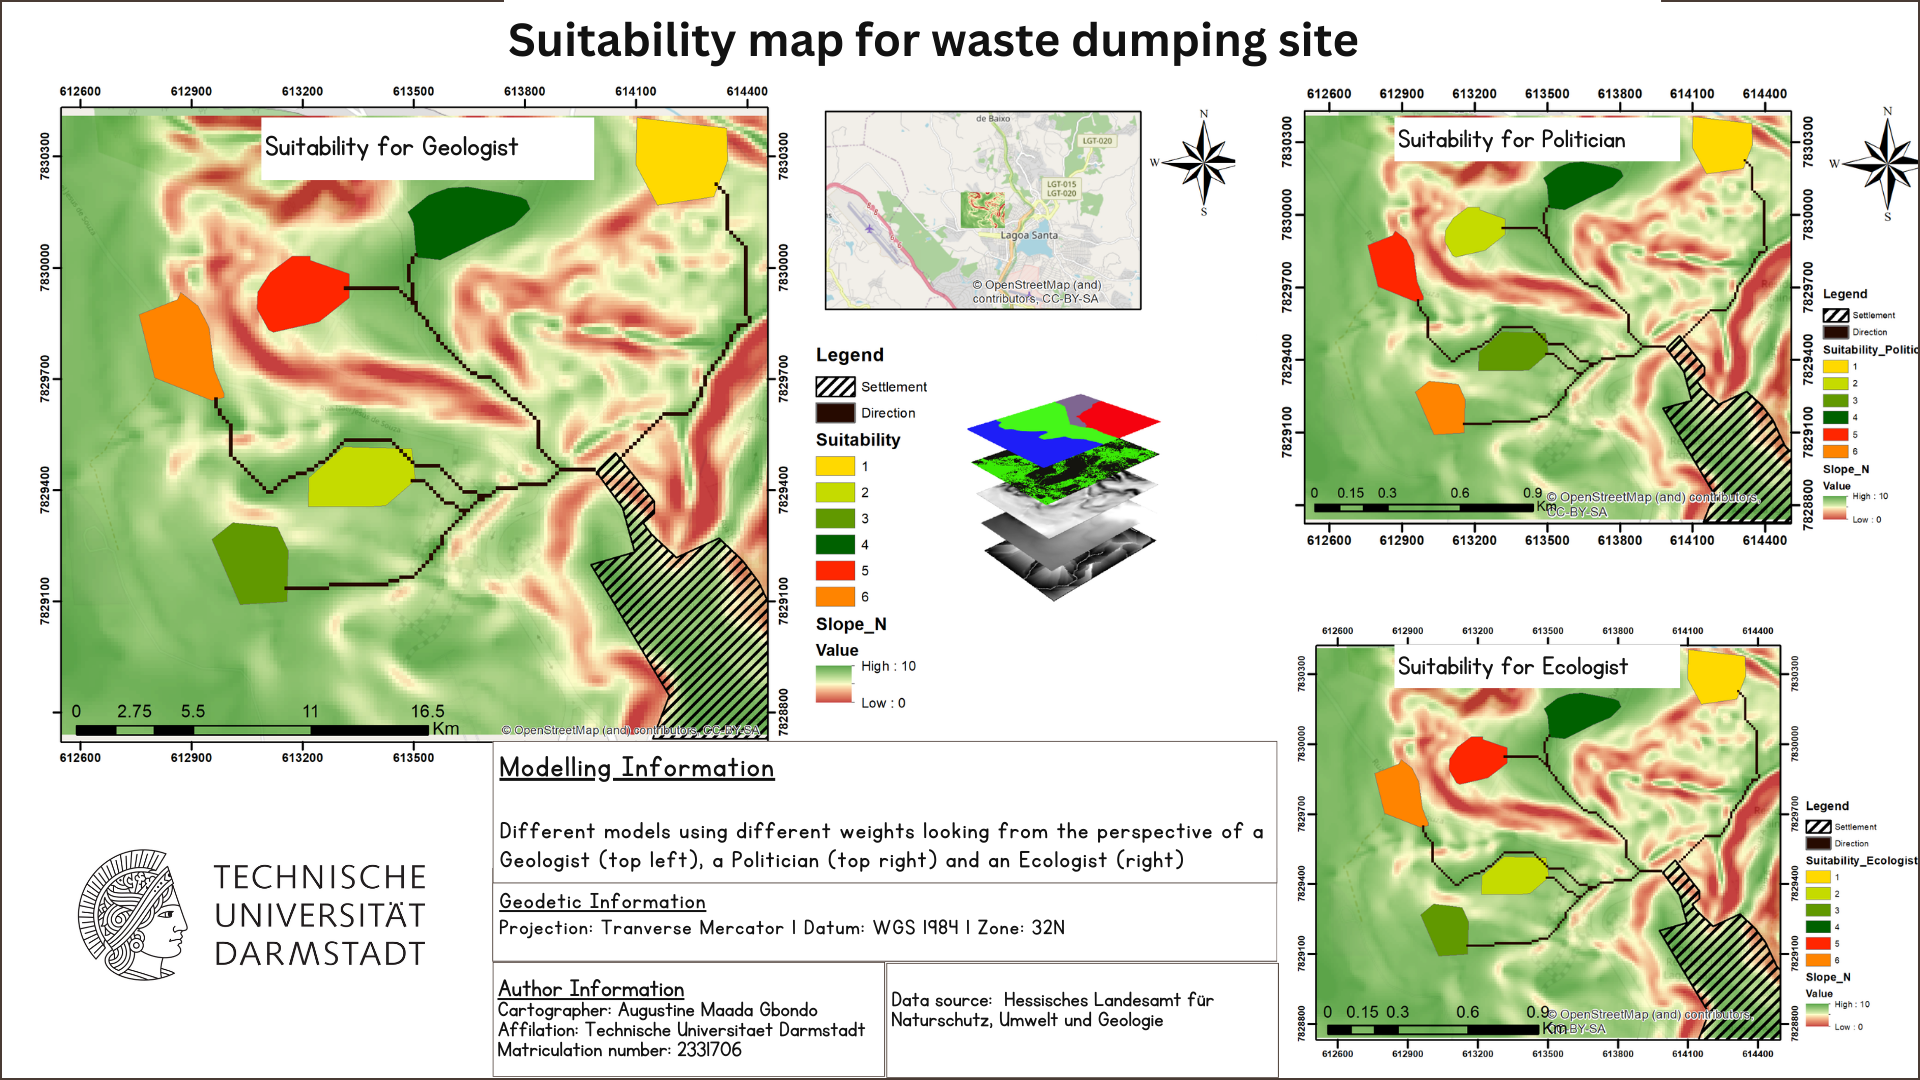
Two additional maps were created by changing the weights to get the perspective of an Ecologist (gives high priority to Ecology and Biodiversity) and Politician (priority to reduce cost i.e distance to site)
Deliverables
 </p>
</p>
The figure shows three maps modelled using different weighted input parameters. The suitability was ranked 1 to 6, 1 - representing the best suitable site and 6 - representing the least suitable site
Comments
Project Title : A 3D WebScene including hydrological and geological information
Tools used : ESRI Geodatabase, Toolboxes: [GeologicToolbox a custom developed toolbox Schmidt et. al (2017) to import the sGrids], [Spatial Analyst toolbox –> ({Interpolation toolset –> IDW}, {Surface toolset –> Contour})] ArcScene for 3D Visualization, ArcGIS Online for webmapping, WebScene for 3D Visualization online.
Background and method
This project was designed to work with SKUA GOCAD SGrids data in ArcGIS Pro, and add a 2D basemap as a 3D geological data to ArcScene. The second part of the exercise include groundwater contouring using groundwater heads data, which was also added to the webscene.
SGrids: also referred to as Structured grids, are a type of data structure popular in geosciences. It is used to represent spatial data - particulary structures that varies continously over space. these were provided by the Geoinformation Science Group at Technische Universitaet Darmstadt.
 </p>
</p>
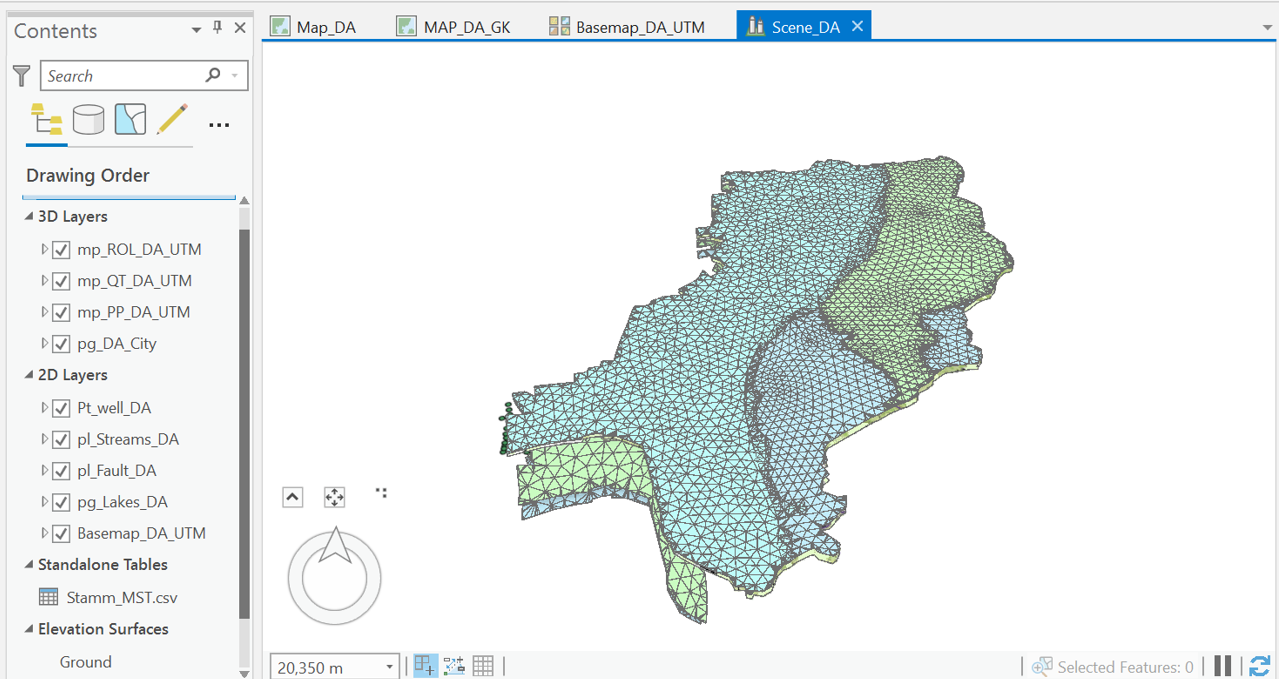
sGrid representing some of the geological units in Darmstadt viewed in ArcScene
Groundwater level data: Data of groundwater heads was retrieved from GruSchu (http://gruschu.hessen.de) - the specialized information system for groundwater and drinking water protection for the federal state of Hesse. It is governed by the Hessian Agency for Nature Conservation, Environment and Geology (www.hlnug.de).
Methodology
The SKUA-GOCAD data was imported into ArcGIS Pro using the (GeologicToolbox), and then coordinate reference system was then reprojected. These layers were then published to ArcScene.
Groundwater level data for two months, April and October were interpolated (using IDW method), and contours using the Countour tool for each month. The created contours and other layers were then published in ArcScene.
Deliverables
Groundwater contour map
Comments/Future works
Does the type of interpolation method use affect the spatial model of groundwater heads in the project area?
- Test different interpolation methods e.g Kriging, IDW, Spline etc.
- Develop a semi-variogram for kriging method