
Geospatial programming
Project Title : Land Use Land cover classification of Ar-Raqqa, Syria.
Project Status: Completed
Overview
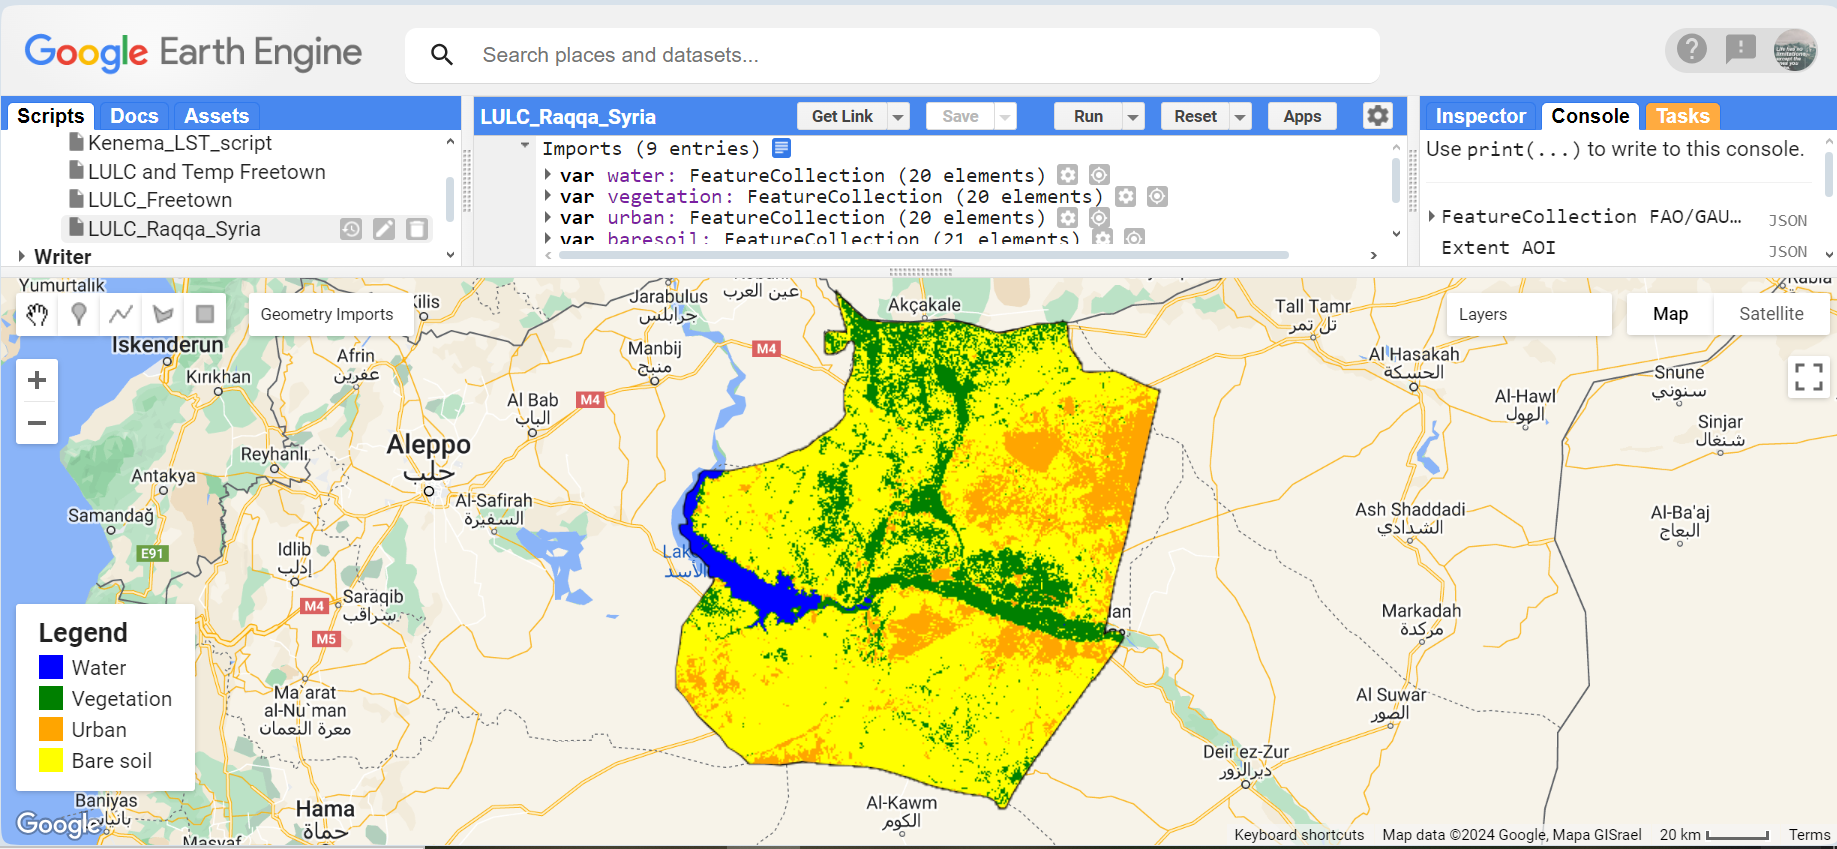
This project was built on the Frei-Universitaet Berlin GEO-IT coursework. The main aim is using geospatial technologies for environmental monitoring and assessment. Remote sensing data and machine learning algorithms within Google Earth Engine were used to classify land cover in Ar-Raqqa, Syria. A land surface temperature (LST) layer was also overlaid on the map, to visualize the spatial variability of Temperature.
Key technologies and skills : Javascript, Google Earth Engine (GEE)
Method
The Area of Interest (AOI) was classified into four land use classes (Water, Vegetation, Urban and barren) by creating training classes from point geometry. Two models (CART model and Random Forest Model) were compared in terms of accuracy socre. The final results of the classification showed that the Random Forest model had a 90% accuracy, while the CART model with a 86% accuracy.
**
 </p>
</p>
Land use land cover mapping of Raqqa using CART, and Random Forest supervised classification techniques
The Google Earth Engiene code can be found here
Comments/Future works
- Investigate if the accuracy of the classification change based on classification algorithm used, and/or based on Technology used?
- Is there a relationship between the LULC and Temperature change over time?
Project Title : An interactive visualization of the maps used in my research paper
Link to research paper
Key technologies and skills : python *html, leaflet.js and css
Overview
During our publication, we created several maps and charts to better present our results. One such representation was the creation of several maps with ISO-3DIGIT codes of countries, to represent each country and associated data. Although this was a professional way of presenting our results, some readers may struggle to decipher these geographical codes.
This project was done (unofficially) to ensure better visualizations of the maps in the publication. An interactive webmap with country names, ISO-3DIGIT codes and the statistics for each country and layer will be created.
Summary of method
Data Transformation : The data required transformation from a shapefile to a geojson file (compartible for web maping services). A python script was developed to automate this conversion.
Webmap development : To develop the web map, html, leaflet.js and css were used. The aim was to depoly all relevant layers on the map with a responsive popup, and each with their own legend. I created some leaflet.js functions and conditional statements to take effect based on layer. More information can be found in the github repository
Map
Details of the map layers and the interface can be accessed below.
Layer description
 </p>
</p>
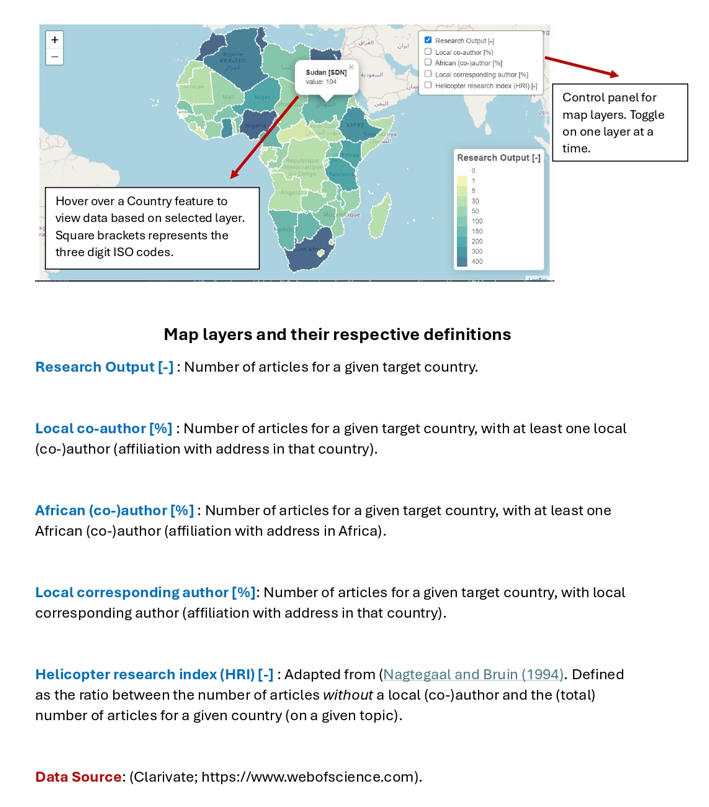
A short description of how to use the webmap below, and definitions of each layer - as described in the publication
webmap Interface
</p>
The interactive webmap interface
Project Title : Development of a relational database management system for my personal projects.
Key technology and skills Tools, PostgreSQL/PostGIS, ESRI Database, SQL-Alchemy, TimescaleDB